Web Demos
There are no Web Demos scheduled at this time. To be notified of any upcoming Web Demos, please join our mailing list.
Previous Web Demos:
Recorded Demos - Download and Watch
Thursday, October 2nd 2014, 3-4pm ET
What's New in SigmaXL Version 7
Presenter: John Noguera, Co-Founder and CTO of SigmaXL
SigmaXL Version 7 has added some exciting, new and unique features. This webinar will give an overview of these features.
Download the PowerPoint slide here
Thursday, April 25th, 2013th, 2-3 pm EDT
SigmaXL 6.2 Web Demo
Presenter: John Noguera, Co-Founder and CTO of SigmaXL
John Noguera, Co-Founder and CTO of SigmaXL, discusses the 4 new and 6 upgraded templates included in SigmaXL 6.2
Download the PowerPoint slide here
Monday, September 24th, 2-3 pm EDT
DiscoverSim™ Web Demo
Presenter: John Noguera, Co-Founder and CTO of SigmaXL
John Noguera, Co-Founder and CTO of SigmaXL, will demonstrate how DiscoverSim™ can help you minimize costs, maximize profits, and optimize your processes.
Wednesday, April 4th, 2012 2-3 pm EDT
Multiple Response Optimization and Practical Tolerance Design Using DiscoverSim™
Presenter: John Noguera, Co-Founder and CTO of SigmaXL
Agenda:
This webinar will feature a Design for Six Sigma (DFSS) case study using SigmaXL’s new DiscoverSim Monte Carlo Simulation and Optimization tool:
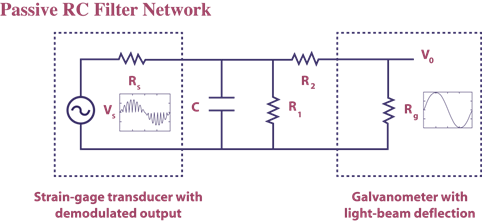
The passive low pass resistor capacitor filter network shown below has been analyzed in several papers. It will be used to demonstrate how DiscoverSim allows you to easily solve the difficult problems of multiple response optimization for parameter design and practical tolerance design.
Duration: 50 minutes
Q&A: 10 minutes
Wednesday, January 25th, 2-3 pm EST
Three Case Studies Using DiscoverSim™
Presenter: John Noguera, Co-Founder and CTO of SigmaXL
The Web Demo will cover the following three case studies.
1. Retail Profit Simulation:
This is an example of Monte Carlo simulation to determine probability of daily profit using a basic profit model for a small retail business. We will apply distribution fitting to historical data and specify input correlations to define the model in a way that closely matches our real world business. Sensitivity analysis will be performed to determine the key input factors affecting profit.
2. Magazine Production Optimization:
This is an example of simulation and optimization to determine optimal magazine production quantity for newsstand distribution to maximize net profit. A custom discrete distribution will be used to model customer demand.
3. Six Sigma DMAIC Project Portfolio Selection:
This is an example of discrete optimization used to select projects that maximize expected cost savings and minimize variability subject to a constraint of total resources.
Demonstration: 50 minutes
Q&A: 10 minutes
Wednesday, December 14, 2-3 pm EST
Variation Reduction Using DiscoverSim™
Presenter: John Noguera, Co-Founder and CTO of SigmaXL
Agenda:
- Introduction to DiscoverSim
- What Is Monte Carlo Simulation?
- The Power of Global Optimization
- Case Study: Reduce variation when firing a catapult
Demonstration: 50 minutes
Q&A: 10 minutes
October 12th, 2011
Variation Reduction and Robust Design Using DiscoverSim™
Presenter: John Noguera, Co-Founder and CTO of SigmaXL
Agenda:
- Introduction to DiscoverSim
- Monte Carlo Simulation
- Stochastic Global Optimization
- Case Study: Robust Design of Shut-Off Valve Spring Force
Downloads: PowerPoint Slides
Demonstration: 50 minutes
Q&A: 10 minutes
June 29th, 2011
How to Deal With Nonnormal Data in Process Improvement Projects
Presenter: John Noguera, Co-Founder and CTO of SigmaXL
This webinar will cover the real world issues around dealing with nonnormal data in process improvement projects. Topics will include:
Agenda:
- When do I need to worry about Nonnormal data (i.e., is the Central Limit Theorem working for me)?
- Guidelines on sample size for central limit theorem to work (for mild, moderate and severe skewness)
- Do I have Outliers or Inherently Nonnormal data?
- Do I need to stratify to deal with a bimodal distribution?
- How do I deal with Nonnormality due to measurement discrimination (“chunky” data)
- SigmaXL tools to detect Nonnormality
- Graphical Tools: Histogram, Boxplot, Normal Probability Plot, Control Chart
- Anderson Darling Normality Test
- SigmaXL tools to deal with Nonnormality
- Nonparametric Tests
- Transformations and Distribution Fitting
Downloads: Presentation Data , PowerPoint Slides
Demonstration: 50 minutes
Q&A: 10 minutes
Wednesday May 4th
Introduction to Logistic Regression
Presenter: John Noguera, Co-Founder and CTO of SigmaXL
Have you ever wondered how researchers determine the odds of lung cancer versus risk factors such as years of smoking and number of cigarettes smoked per day?
Lung cancer (and other diseases) are discrete in nature. You either have cancer or you don't. Years of smoking and number of cigarettes are continuous predictors. So the tool researchers use is Binary Logistic Regression.
Binary Logistic Regression is also a powerful tool to help determine the root causes of manufacturing or transactional defects.
This webinar will introduce you to SigmaXL's Logistic Regression Tools.
Agenda:
- Introduction to Binary Logistic Regression (How it differs from Least Squares Regression)
- Data Format
- Interpretation of SigmaXL's Output
- P-Values
- Odds Ratios
- Pseudo R-Square
- Goodness of Fit Tests
- Residuals Analysis
- Event Probability Calculator
- Ordinal Logistic Regression
Demonstration: 40-50 minutes
Q&A: 10 minutes
Wednesday, Dec 23rd
Case Study: Using SigmaXL and DMAIC to Improve Customer Satisfaction*
By: John Noguera, CTO and cofounder, SigmaXL Inc.
We demonstrate how SigmaXL’s user-friendly and powerful graphical and statistical tools were used to identify key drivers linked to customer satisfaction, including:
- Basic Data Manipulation
- Descriptive Statistics
- Histograms
- Process Capability for Normal and Nonnormal Data
- Pareto Charts
- Boxplots
- Multi-Vari Charts
- Hypothesis Testing – ANOVA
- Scatter Plots and Scatter Plot Matrix
- Multiple Linear Regression
- Hypothesis Testing 2 Sample Comparison: “before improvement” versus “after improvement”
- Control charts with split limits also clearly show the “before improvement” versus “after improvement” results.
Case Study: 50 Minutes
Q&A: 10 Minutes
Note: Any web demo can be scheduled, customized and presented to
companies or organizations interested in SigmaXL
Wednesday, Sept. 30th
Introduction to SigmaXL Version 6
By: John Noguera, CTO and cofounder, SigmaXL Inc.
This webinar will introduce the powerful and user friendly features in SigmaXL Version 6. This includes an overview of:
- Powerful Excel Workbook/Worksheet Manager
- Lean Value Stream Mapping Template
- Process Capability and Control Charts for Nonnormal data with Automatic Best Fit
- Distribution Fitting Report
- Response Surface Design of Experiments
- Contour and 3D Surface Plots
- New Statistical Calculators
- New Probability Distribution Calculators
- New Random Number Generators
Demonstration: 40-50 minutes
Q&A: 10 minutes
Wednesday, Oct 14th
Process Capability and Statistical Process Control (SPC) with SigmaXL
By: John Noguera, CTO and cofounder, SigmaXL Inc.
We demonstrate and explain SigmaXL's Process Capability and Statistical Process Control features including:
- Capability Combination Report
- Process Capability for Nonnormal Data
- Control Charts for Normal and Nonnormal data
- Control Chart features: Split Limits, Exclude Data, Add Comment
Demonstration: 40-50 minutes
Q&A: 10 minutes
Wednesday, Oct 21st
Multiple Regression and Design of Experiments (DOE) with SigmaXL
By: John Noguera, CTO and cofounder, SigmaXL Inc.
We demonstrate and show how to use SigmaXL's user-friendly and powerful Multiple Regression and DOE tools:
- Multiple Regression
- Design of Experiments Templates
- Full and Fractional Factorial Designs
- Response Surface Methods
- Contour and 3D Surface Plots
Demonstration: 40-50 minutes
Q&A: 10 minutes
Wednesday, March 24th
Prioritize Properly with Pareto Charts and EZ-Pivot
Presenter: John Noguera, co-founder and CTO of SigmaXL
We demonstrate SigmaXL’s powerful Pareto Charts and EZ-Pivot tool to help you slice and dice your data to separate the vital few X’s from the trivial many possibilities.
Demonstration: 30 minutes
Q&A: 10 minutes
Thursday, February 24th
Introduction to SigmaXL Version 6.1
Presenter: John Noguera, co-founder and CTO of SigmaXL
This webinar will cover the improvements and new features added in SigmaXL Version 6.1:
- Now compatible with Excel 2010 64 bit version
- Updated Cause & Effect (XY) Matrix Template with Pareto Chart option
- Updated Failure Mode & Effects Analysis (FMEA) Template with Risk Priority Number (RPN) Sort
- Create Stacked Column Format for “Analyze Gage R&R” >> button
- Updated Attribute MSA Template with Create Stacked Column Format to Analyze with “Attribute MSA (Binary)” >> button
- Add Data menu options for Control Charts now include: “Add Data to this Control Chart” and “Add Data to all Control Charts”
- Capability Combination Report, Distribution Fitting and Control Charts for nonnormal data have updated dialogs with the distribution selection options displayed visually. This makes it easier to determine which distribution to select.
Demonstration: 40-50 minutes
Q&A: 10 minutes
Wednesday, March 30th
Correlation and Multiple Regression with SigmaXL
Presenter: John Noguera, co-founder and CTO of SigmaXL
Join us to learn how SigmaXL can help you quickly determine relationships in your data and identify the key drivers (X factors) affecting your business performance. Topics will include:
- Graphical Tools: Scatter Plot and Scatter Plot Matrix
- Correlation
- Simple Linear Regression
- Multiple Linear Regression
- Interpretation of Output
- Residuals Analysis
- Dealing with Continuous and Categorical Predictors
- Using the Predicted Response Calculator
- Case Study: Customer Satisfaction Data
Duration: 40-50 min
Q & A: 10 min